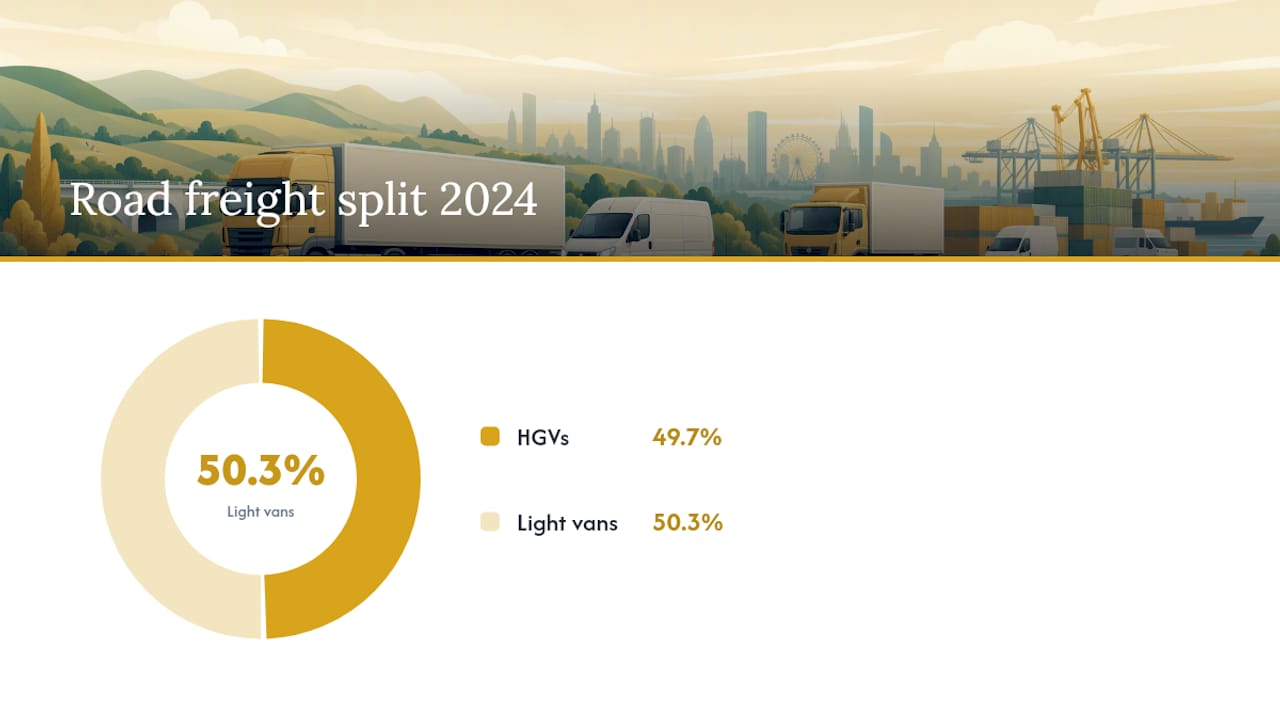
UK road freight generated roughly 37 MtCO2e in 2024, split almost evenly between heavy goods vehicles at 18.4 MtCO2e and light commercial vans at 18.6 MtCO2e. That van figure now edges ahead of HGVs, a reversal that would have seemed unlikely a decade ago and one that reflects the sheer scale of e-commerce delivery growth rather than any single policy failure.
For operators and policymakers, the practical implication is straightforward: efficiency measures aimed only at the HGV fleet now address barely half the problem. Any credible decarbonisation strategy for road logistics has to treat vans and heavy trucks as two distinct challenges, each with different fuel profiles, duty cycles and technology readiness. The figures below draw on the Department for Transport's transport and environment statistics and the National Atmospheric Emissions Inventory, the two datasets that underpin almost every credible claim made about UK freight emissions.
Key Takeaways
Cutting UK road freight CO2 depends on treating HGVs and light vans as separate problems, prioritising load factor and empty-running fixes before betting on fleet electrification alone.
| Point | Details |
|---|---|
| Vans now rival HGVs | Light vans produced 18.6 MtCO2e against 18.4 MtCO2e from HGVs in 2024, roughly matching totals. |
| Road carries most freight | Road moved 82% of domestic freight tonne-kilometres in 2024, around 168 billion tonne-km. |
| Use the right conversion factors | Reference annually updated Government conversion factors and disclose the factor year in any report. |
| Fix load factor first | Improving vehicle utilisation and cutting empty running remains the cheapest available emissions lever. |
| HGV electrification is early | Zero-emission HGVs reached 0.99 thousand licensed vehicles in 2024, still a small share of the fleet. |
| Match vehicle to job | Sddbyaba right-sizes vehicles from motorcycles to 26 tonne trucks and runs dedicated legs to cut empty mileage. |
Table of Contents
- Road freight CO2 UK: the headline figures and short-term trend
- How CO2 for road freight is actually measured in the UK
- What is driving the shift in UK freight emissions
- UK policy direction for road freight decarbonisation
- Practical steps operators can take to cut freight CO2
- Reporting freight emissions and building it into procurement
- A same-day courier's approach to lower carbon intensity
- Three priorities for cutting UK freight CO2
- Lower carbon intensity without changing how fast goods move
- Sources
Road freight CO2 UK: the headline figures and short-term trend
HGVs contributed a significant share of domestic transport greenhouse gas emissions in 2024, with 18.4 MtCO2e reported. Light vans added another 18.6 MtCO2e, a figure that has climbed steadily as parcel volumes and last-mile delivery demand have grown. Together, these two vehicle categories account for the overwhelming majority of what gets classified as road freight CO2 in official statistics, with cars and buses tracked separately under passenger transport.
The trend line matters as much as the snapshot. Van emissions have risen consistently over the past several years, a pattern tied directly to the structural shift toward smaller, more frequent deliveries rather than fewer, fuller loads. HGV emissions, by contrast, have moved less dramatically, reflecting a fleet that is larger, more capital-intensive, and slower to turn over than the van sector.
Activity data explains why. In 2024, 82% of domestic freight tonne-kilometres moved by road, with total GB road freight activity reaching roughly 168 billion tonne-kilometres. Road retains this dominant share because rail and coastal shipping simply cannot match its flexibility for time-sensitive, multi-drop consignments, particularly in retail replenishment and construction supply chains.
Three activity measures matter most when interpreting the headline numbers:
- Tonne-kilometres measure how much freight moves and how far, capturing the combined effect of volume and distance rather than vehicle count alone.
- Vehicle kilometres track how far vehicles travel regardless of load, which is why empty running inflates this figure without moving any goods.
- Goods lifted records the physical tonnage handled, useful for understanding warehouse and distribution throughput independent of distance.
Reading these three measures together tells you whether emissions are rising because more goods are moving, because they are travelling further, or because vehicles are running less efficiently. A rise in vehicle kilometres without a matching rise in tonne-kilometres is usually a red flag for load factor problems, something we return to later.
The van growth story deserves particular attention because it is not simply an emissions problem, it is a symptom of a wider logistics shift. Retailers and marketplaces increasingly ship single items directly to consumers instead of bulk pallets to stores, which means more vehicles, more trips, and more CO2 per unit of goods delivered. Some of this growth also reflects genuine economic expansion in online retail rather than pure inefficiency, so simple year-on-year comparisons need a note of caution: activity and emissions rarely move at identical rates once vehicle mix and route density are factored in.
How CO2 for road freight is actually measured in the UK
Getting the methodology right matters more than most people assume, because two operators reporting "the same" delivery can produce different CO2 figures depending on which factors and boundaries they apply. The starting distinction is CO2 versus CO2e (carbon dioxide equivalent), which folds in methane and nitrous oxide alongside CO2 using their global warming potential. Almost every freight figure quoted in UK government statistics is CO2e, not pure CO2, and conflating the two is a common source of confusion in industry reporting.
The second distinction is direct (tailpipe) emissions versus Well-to-Tank (WTT) emissions. Tailpipe figures capture only what comes out of the exhaust; WTT captures the emissions embedded in producing and delivering the fuel itself, from extraction through refining to distribution. Comparing a diesel HGV against an electric one on tailpipe emissions alone will always flatter the electric vehicle, because it ignores the upstream emissions from generating that electricity. Fair comparisons require Well-to-Wheel figures that combine both.
For calculating actual emissions, two reference sources do almost all the heavy lifting in the UK:
- Government conversion factors, published annually and recommended for company reporting, give fuel-specific and vehicle-specific factors ready to multiply against activity data.
- NAEI road transport emission factor notes explain how the national inventory derives its figures, including why inventory-implied factors shift as the fleet mix refreshes with newer, cleaner vehicles.
Allocation method changes the result too. Emissions can be allocated by vehicle-kilometre (spreading a trip's emissions evenly regardless of load) or by tonne-kilometre (allocating emissions in proportion to weight carried). A part-loaded return leg looks very different depending on which method you choose, and neither is wrong, they simply answer different questions: vehicle-km suits fleet-level reporting, tonne-km suits per-consignment carbon intensity.
Defra and DfT's freight GHG guide sets out worked examples for exactly this kind of calculation, and it remains the most practical starting point for anyone building a company-level reporting methodology from scratch.
Pro Tip: Fix the conversion factor year you use for a given reporting period and state it explicitly in your report. Factors update annually, and mixing years within a single comparison quietly distorts your trend data without anyone noticing until an auditor asks.
What is driving the shift in UK freight emissions
Van growth is the single biggest structural driver behind the current emissions picture, and it traces directly back to consumer behaviour rather than freight sector inefficiency. Every parcel that used to arrive as part of a bulk store delivery now potentially generates its own dedicated trip, multiplying vehicle movements even where total goods volume barely changes.

HGV tonne-kilometres tell a steadier story. Heavy vehicles still carry the bulk of the UK's actual freight weight, and their emissions share has grown far more slowly than the van sector's because the fleet turns over gradually and routes tend to be longer and more consolidated by nature. That consolidation is precisely why HGVs remain more carbon-efficient per tonne moved than vans, even though their total emissions figure sits close behind them.
Load factor and empty running deserve more attention than they typically get in public debate. The Freight Carbon Review identified this as one of the cheapest, fastest levers available to the sector, and that conclusion has aged well.
A handful of structural factors compound these effects:
- Modal shift limitations mean rail and coastal shipping cannot realistically absorb much more freight volume without major infrastructure investment, keeping road's 82% share largely fixed in the near term.
- Economic activity levels directly drive tonne-kilometre demand, so freight emissions tend to track GDP and consumer spending more closely than any single technology change.
- Delivery frequency expectations from consumers push toward smaller, more frequent shipments, working directly against the consolidation gains that reduce emissions per tonne.
- Driver shortages and scheduling pressure can reduce the flexibility needed to plan efficient backhauls, indirectly worsening empty running rates.
UK policy direction for road freight decarbonisation
Government policy for heavy freight is moving toward a phased regulatory approach rather than a single hard cutoff. The ongoing consultation on a new HGV CO2 emissions regulatory framework points toward phasing out sales of non-zero emission HGVs by 2040, with earlier target dates under discussion for lighter truck categories, broadly in the 2035 window. Operators planning fleet renewal cycles now need to factor these dates into vehicle purchasing decisions made years in advance.
Progress on the ground remains early-stage. The number of licensed zero-emission HGVs reached 0.99 thousand in 2024, up 34% year-on-year from 0.74 thousand in 2023. That growth rate looks impressive in percentage terms but starts from a tiny base against a UK HGV fleet numbering hundreds of thousands, underlining that heavy freight electrification remains a multi-decade transition rather than an imminent shift.
Several policy strands shape the near-term landscape for operators:
- Carbon budgets and the Emissions Reduction Plan set the overarching UK trajectory that transport, including freight, must contribute toward, with road transport under particular scrutiny given its slower progress relative to power generation.
- Clean Air Zones in cities including London, Birmingham and Bristol impose charges on older, higher-emission HGVs and vans, creating an operational cost incentive that sits alongside the carbon case for fleet upgrades.
- Grant and trial programmes, including support for zero-emission HGV trials and charging infrastructure, aim to de-risk early adoption for operators willing to move ahead of the regulatory curve.
- Reporting expectations are tightening gradually, with government increasingly expecting larger fleet operators to disclose emissions using standard conversion factors rather than bespoke internal methodologies.
Practical steps operators can take to cut freight CO2
Reducing road logistics emissions UK-wide does not require waiting for a fully electrified HGV fleet. Most of the available carbon savings sit in operational decisions that fleet managers can act on this quarter, not this decade.
-
Improve load factor before anything else. A vehicle running consistently at 90% capacity instead of 60% cuts carbon intensity per tonne delivered by roughly a third without touching the vehicle or the fuel. Consolidation of smaller consignments into shared loads is the single most cost-effective lever the sector has, a conclusion the Freight Carbon Review reached and one that still holds.
-
Cut empty running through better backhaul planning. Every return leg run empty effectively doubles the carbon cost of the outbound journey. Commercial collaboration models, including shared consolidation hubs and multi-client dedicated runs, give smaller operators access to the kind of backhaul matching that only large fleets could previously manage alone.
-
Use route optimisation and telematics to trim unnecessary mileage. Modern routeing software and live telematics data reduce vehicle kilometres by identifying shorter routes, avoiding congestion, and flagging idling time that burns fuel without moving goods. The savings are incremental rather than dramatic, typically single-digit percentage reductions in fuel use, but they compound across a full fleet operating daily.
-
Right-size the vehicle to the job. Sending a large van or 7.5 tonne truck for a load that a car or motorcycle courier could carry wastes fuel and inflates emissions per consignment. Matching vehicle class to actual job requirements, something covered in detail in guidance on courier vehicle selection, is one of the simplest changes an operator can make without capital investment.
-
Treat electrification as a segment-specific decision, not a blanket strategy. Small and medium vans on urban, predictable routes are strong candidates for battery electric conversion today, given shorter ranges and reliable overnight charging opportunities. Long-haul HGVs face a harder problem: range, payload trade-offs and charging infrastructure gaps mean the transition timeline for heavy trucks realistically extends well into the 2030s for most operators, and grid and charging readiness will shape how fast that happens.
-
Account properly for Well-to-Tank emissions before claiming fuel-switching savings. Comparing diesel against biodiesel or electricity purely on tailpipe figures overstates the benefit. Include WTT emissions in any fuel-switching business case, particularly for electricity where grid carbon intensity varies by time of day and region.
Pro Tip: Before spending on new vehicles or fuel-switching pilots, audit your current load factor and empty-running rate first. Most fleets find measurable emissions savings sitting in scheduling and consolidation, at a fraction of the cost of a vehicle replacement programme.
Reporting freight emissions and building it into procurement
Sound emissions reporting starts with picking the right conversion factor set and sticking with it. Use the government's annually published conversion factors for company reporting, and disclose the specific factor year applied, since factor updates shift results year to year in ways that can distort trend comparisons if left unstated. Most freight activity sits in Scope 3 for shippers using third-party carriers, while operators running their own fleet report it under Scope 1.
Absolute emissions figures matter for compliance, but intensity metrics tell you whether operations are actually improving. Grams of CO2 per tonne-kilometre strips out the effect of business growth, letting a company distinguish genuine efficiency gains from emissions that simply rose because volume rose. This is a distinction procurement teams should build directly into supplier scorecards.
A short checklist for near-term decisions:
- Request gCO2/tonne-km intensity data from carriers, not just absolute totals, when evaluating logistics suppliers.
- Weight procurement KPIs to reward load factor and route efficiency improvements, not only vehicle age or fuel type.
- Confirm which conversion factor year a supplier's reported figures use before comparing bids.
- Flag any fleet renewal decision against the 2035/2040 regulatory timeline before committing to long asset lifespans.
A same-day courier's approach to lower carbon intensity
Same-day operations illustrate these principles at practical scale. Matching consignment size to the smallest suitable vehicle, from motorcycle couriers up to 26 tonne trucks, keeps carbon intensity down without sacrificing delivery speed.
- Job-to-vehicle matching avoids sending oversized vehicles for small urgent loads, a discipline explained further in guidance on urgent freight movement.
- Dedicated runs reduce reliance on multi-drop routes that inflate vehicle-kilometres for time-critical consignments.
- Telematics data, mapped against government conversion factors, gives operators a defensible way to calculate and report actual fuel-based emissions rather than estimates.
Three priorities for cutting UK freight CO2
Get the data right before chasing new vehicles. Standardised reporting exposes where load factor and empty running are actually costing you, and that should come before any electrification spend. Battery HGVs are not a universal answer yet, range and charging gaps make them segment-specific, so pair fleet transition with collaborative backhaul models that cut empty mileage today, not in 2040.
— Ayomide
Lower carbon intensity without changing how fast goods move
Sddbyaba gives operators a practical route to lower carbon intensity logistics UK-wide without the empty-leg waste that inflates most freight carbon footprints. Our fleet spans motorcycles through to 26 tonne and artic trucks, so jobs get matched to the smallest suitable vehicle rather than defaulting to oversized capacity, cutting fuel burn per consignment from the outset.

Three things set our approach apart for emissions-conscious operators: right-sizing every job against actual load requirements, dedicated runs that avoid the empty return legs that double carbon intensity on multi-drop routes, and telematics-enabled routeing that keeps vehicle kilometres tight against actual tonne-kilometres delivered. Whether you need freight haulage for heavier loads or scheduled commercial logistics support, we can map your consignment profile against the right vehicle mix. Get in touch through Sddbyaba to request a fleet emissions consultation and see where your current load factor and empty running stand.
Sources
- Greenhouse gas emissions from transport in 2024
- Guidance on measuring and reporting Greenhouse Gas (GHG) emissions from freight transport operations
- Road Transport Emission Factors: 2024 NAEI
- Freight Carbon Review (2017)